Ever wondered why your server crashes or your app slows down? A solid system monitor could be the hero you didn’t know you needed. Let’s dive into the world of real-time tracking, performance insights, and proactive alerts that keep your tech running like a well-oiled machine.

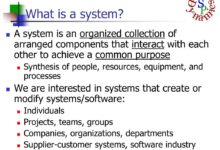


What Is a System Monitor and Why It Matters

A system monitor is a software tool or hardware solution designed to track, analyze, and report the performance and health of computing systems. Whether it’s a single desktop, a fleet of servers, or an entire cloud infrastructure, a system monitor provides real-time visibility into critical metrics such as CPU usage, memory consumption, disk I/O, network activity, and application responsiveness.
Core Functions of a System Monitor
The primary role of a system monitor is to ensure system reliability, optimize performance, and prevent downtime. It does this by continuously collecting data from various system components and presenting it in a usable format—often through dashboards, alerts, or logs.
- Real-time performance tracking
- Automated alerting for anomalies
- Historical data logging for trend analysis
- Integration with incident management tools
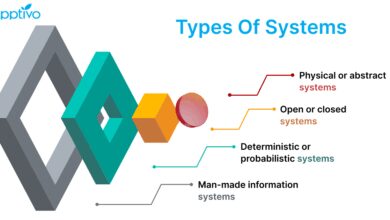
Types of System Monitoring
Not all monitoring is created equal. Depending on the environment and goals, different types of system monitoring are employed:
- Hardware Monitoring: Tracks physical components like temperature, fan speed, and power supply status.
- Software Monitoring: Observes application performance, process health, and service availability.
- Network Monitoring: Analyzes bandwidth usage, latency, packet loss, and connectivity.
- Cloud Monitoring: Focuses on virtualized environments, container performance, and auto-scaling behavior.
“Monitoring is not about collecting data—it’s about turning data into decisions.” — Site Reliability Engineering, Google
Top 7 System Monitor Tools in 2024
Choosing the right system monitor can make or break your IT operations. Below is a curated list of the most powerful and widely used tools in the industry, each offering unique strengths for different use cases.
1. Nagios XI – The Veteran Powerhouse
Nagios XI has been a cornerstone in system monitoring for over two decades. Known for its robustness and flexibility, it supports a vast array of plugins and integrations, making it ideal for complex, on-premise environments.
- Extensive plugin ecosystem for custom monitoring
- Advanced alerting and escalation workflows
- Supports hybrid and multi-cloud setups
Despite its steep learning curve, Nagios XI remains a favorite among enterprise IT teams. Learn more at Nagios Official Site.
2. Zabbix – Open-Source Giant
Zabbix stands out for its scalability and open-source nature. It’s capable of monitoring thousands of devices in real time, making it perfect for large-scale deployments.
- Auto-discovery of network devices
- Built-in visualization and reporting tools
- Supports SNMP, IPMI, JMX, and custom scripts
Zabbix is particularly strong in environments where cost efficiency and customization are key. Visit Zabbix.com for documentation and downloads.
3. Datadog – Cloud-Native Leader
Datadog is a SaaS-based system monitor built for modern cloud environments. It excels in monitoring microservices, containers (like Docker and Kubernetes), and serverless functions.
- Seamless integration with AWS, Azure, and GCP
- AI-powered anomaly detection
- Unified platform for logs, metrics, and traces
Datadog’s real strength lies in its ecosystem. It connects with over 600 technologies, from databases to CI/CD pipelines. Explore it at Datadoghq.com.
4. Prometheus – The DevOps Favorite
Prometheus is an open-source monitoring and alerting toolkit originally built at SoundCloud. It’s now a CNCF (Cloud Native Computing Foundation) graduate project and a go-to for Kubernetes environments.
- Pull-based monitoring model with time-series database
- PromQL for powerful querying
- Highly scalable and container-friendly
Prometheus is lightweight and efficient, but requires additional tools like Grafana for visualization. Check it out at Prometheus.io.
5. PRTG Network Monitor – All-in-One Suite
Developed by Paessler, PRTG is a comprehensive system monitor that combines network, server, and application monitoring in a single platform.
- Auto-discovery of network devices
- Intuitive web interface with drag-and-drop dashboards
- Supports SNMP, WMI, NetFlow, and packet sniffing
PRTG is ideal for mid-sized businesses looking for an easy-to-deploy solution. It offers a free version with up to 100 sensors. Learn more at Paessler.com.
6. SolarWinds Server & Application Monitor (SAM)
SolarWinds SAM is a powerful tool for monitoring both physical and virtual servers, as well as business-critical applications like SAP, Oracle, and Microsoft SQL Server.
- Deep application performance monitoring
- Pre-built templates for common applications
- Capacity planning and forecasting tools
SolarWinds is known for its user-friendly interface and detailed reporting. However, it’s primarily suited for Windows-centric environments. Visit SolarWinds.com for more.
7. New Relic – Full-Stack Observability
New Relic offers a full-stack observability platform that goes beyond traditional system monitoring. It covers infrastructure, applications, browser performance, and even customer experience.
- Real-time code-level visibility
- User session tracking and frontend monitoring
- AI-driven insights and root cause analysis
New Relic is perfect for organizations embracing DevOps and digital transformation. It’s especially strong in identifying performance bottlenecks in web applications. Explore at Newrelic.com.
Key Metrics Tracked by a System Monitor
A good system monitor doesn’t just collect data—it collects the right data. Understanding which metrics matter most can help you set up effective monitoring strategies and avoid information overload.
CPU Usage and Load Average
CPU usage indicates how much processing power is being consumed. Consistently high CPU usage (above 80%) can signal performance bottlenecks or inefficient code.
- Monitor per-core and total CPU utilization
- Track load average over 1, 5, and 15 minutes
- Identify processes consuming excessive CPU
Tools like top, htop, and system monitor dashboards provide real-time CPU insights.
Memory Utilization and Swap Usage
Memory (RAM) is a finite resource. Monitoring memory usage helps prevent out-of-memory (OOM) errors and system crashes.
- Track available, used, cached, and buffered memory
- Watch for excessive swap usage, which slows performance
- Identify memory leaks in applications
A system monitor should alert when memory usage exceeds safe thresholds, typically above 70-80%.
Disk I/O and Storage Health
Disk performance is often a silent killer of system speed. High read/write latency or full disks can cripple applications.
- Monitor disk read/write speeds and IOPS
- Track available disk space and growth trends
- Check SMART status for hardware health (especially HDDs)
Tools like iostat, df, and system monitor integrations provide deep disk insights.
Network Throughput and Latency
Network performance directly impacts user experience, especially for web services and cloud apps.
- Monitor bandwidth usage and peak times
- Track packet loss, jitter, and round-trip time (RTT)
- Identify network bottlenecks or DDoS attacks
SNMP, NetFlow, and packet analysis tools are commonly used by system monitors for network visibility.
How to Choose the Right System Monitor
Selecting the best system monitor depends on your infrastructure, team size, budget, and technical expertise. Here’s a structured approach to help you make the right choice.
Assess Your Infrastructure Needs
Start by mapping your environment. Are you running on-premise servers, cloud instances, containers, or a hybrid model?
- On-premise: Tools like Nagios, Zabbix, or PRTG offer deep control.
- Cloud-native: Datadog, New Relic, or Prometheus are better suited.
- Hybrid: Look for tools with multi-environment support like SolarWinds or Datadog.
Evaluate Scalability and Performance
Will your system monitor handle growth? A tool that works for 10 servers may choke at 100.
- Check maximum nodes/devices supported
- Assess data ingestion and storage limits
- Look for distributed or clustered deployment options
For example, Zabbix can scale to tens of thousands of devices with proper tuning.
Consider Integration and Ecosystem
A system monitor should fit into your existing tech stack. Does it integrate with your ticketing system (e.g., Jira), CI/CD pipeline, or cloud provider?
- API availability for custom integrations
- Pre-built connectors for common platforms
- Support for webhooks and automation
Datadog and New Relic lead in ecosystem breadth, while open-source tools may require more DIY effort.
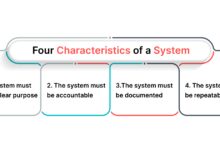
Best Practices for Effective System Monitoring
Even the best system monitor won’t help if used poorly. Follow these best practices to maximize its value and avoid common pitfalls.
Define Clear Monitoring Objectives
Don’t monitor everything—monitor what matters. Start by identifying your critical systems and key performance indicators (KPIs).
- Define uptime targets (e.g., 99.9%)
- Identify mission-critical applications
- Set performance baselines for normal behavior
This focus prevents alert fatigue and ensures actionable insights.
Set Up Smart Alerting
Alerts should inform, not overwhelm. Use thresholds, deduplication, and escalation policies to keep notifications meaningful.
- Avoid alert storms with rate limiting
- Use severity levels (warning, critical, info)
- Route alerts to the right team via email, SMS, or Slack
Tools like Prometheus Alertmanager or PagerDuty integration can help manage complex alert workflows.
Use Dashboards and Visualization
Data is only useful if it’s understandable. Dashboards turn raw metrics into actionable insights.
- Create role-specific dashboards (e.g., ops, dev, management)
- Use time-series graphs, heatmaps, and gauges
- Enable drill-down for root cause analysis
Grafana is a popular choice for building custom dashboards, especially with Prometheus or Zabbix backends.
The Role of AI and Automation in Modern System Monitoring
The future of system monitoring isn’t just about data—it’s about intelligence. AI and machine learning are transforming how we detect, diagnose, and respond to issues.
AI-Powered Anomaly Detection
Traditional threshold-based alerts often miss subtle issues. AI-driven system monitors learn normal behavior and flag deviations automatically.
- Detects unusual patterns before they cause outages
- Reduces false positives by understanding context
- Adapts to changing workloads (e.g., seasonal traffic spikes)
Datadog’s Anomaly Detection and New Relic’s AI Ops are prime examples of this trend.
Automated Root Cause Analysis
When an alert fires, time is critical. AI can analyze logs, metrics, and traces to pinpoint the likely cause.
- Correlates events across services and layers
- Highlights recent deployments or configuration changes
- Provides suggested remediation steps
This capability drastically reduces mean time to repair (MTTR).
Self-Healing Systems
The ultimate goal: systems that fix themselves. Automation scripts can restart failed services, scale resources, or roll back bad deployments.
- Integrate with orchestration tools like Kubernetes
- Use runbooks for common incident responses
- Implement canary deployments with automated rollback
While still emerging, self-healing is a key direction for next-gen system monitors.
Common Challenges and How to Overcome Them
Even with the best tools, system monitoring comes with challenges. Recognizing and addressing them early is crucial.
Alert Fatigue
Too many alerts lead to desensitization. Teams start ignoring warnings, increasing the risk of missing critical issues.
- Consolidate redundant alerts
- Use alert grouping and suppression
- Regularly review and tune alert rules
As Google’s SRE team notes: “An alert should require action. If it doesn’t, it shouldn’t exist.”
Data Overload
Modern systems generate terabytes of telemetry data. Storing and analyzing it all is costly and inefficient.
- Implement data retention policies
- Sample low-priority metrics
- Use tiered storage (hot vs. cold data)
Consider tools with built-in data optimization, like Prometheus’s downsampling or Datadog’s intelligent sampling.
Complexity in Distributed Systems
Microservices, containers, and serverless architectures make monitoring harder due to dynamic and ephemeral components.
- Adopt distributed tracing (e.g., OpenTelemetry)
- Use service mesh integration (e.g., Istio, Linkerd)
- Monitor at the service level, not just the host
Full-stack observability platforms like New Relic or Datadog are designed for this complexity.
Future Trends in System Monitoring
The landscape of system monitoring is evolving rapidly. Here are the key trends shaping its future.
Rise of Observability Over Monitoring
Monitoring asks, “Is the system up?” Observability asks, “Why is it behaving this way?”
- Focus on logs, metrics, and traces (the three pillars)
- Emphasis on context and correlation
- Driven by cloud-native and microservices architectures
Tools are shifting from passive monitoring to active investigation.
Edge Computing Monitoring
As computing moves closer to users (IoT, 5G, edge devices), monitoring must follow.
- Lightweight agents for resource-constrained devices
- Offline data buffering and sync
- Centralized visibility across distributed edge nodes
Expect more edge-optimized system monitors in the coming years.
Green Monitoring and Energy Efficiency
With growing focus on sustainability, monitoring energy consumption is becoming important.
- Track power usage per server or application
- Optimize workloads for energy efficiency
- Integrate with data center infrastructure management (DCIM)
This trend aligns with broader ESG (Environmental, Social, Governance) goals.
What is a system monitor?
A system monitor is a tool that tracks the performance, health, and availability of computer systems, servers, networks, and applications. It collects metrics like CPU, memory, disk, and network usage, and provides alerts when issues arise.
What are the best system monitor tools?
Top tools include Nagios XI, Zabbix, Datadog, Prometheus, PRTG, SolarWinds SAM, and New Relic. The best choice depends on your environment (on-premise, cloud, hybrid), scale, and budget.
How does a system monitor help prevent downtime?
By providing real-time alerts and historical trend analysis, a system monitor allows teams to detect and resolve issues before they escalate into outages. Proactive monitoring reduces mean time to detection (MTTD) and mean time to repair (MTTR).
Can a system monitor work in a cloud environment?
Yes, modern system monitors like Datadog, New Relic, and Prometheus are designed for cloud-native environments. They support auto-scaling, container monitoring, and integration with AWS, Azure, and GCP.
Is open-source system monitoring reliable?
Yes, open-source tools like Zabbix and Prometheus are highly reliable and used by enterprises worldwide. They offer transparency, customization, and strong community support, though they may require more setup effort than commercial tools.
Choosing the right system monitor is no longer optional—it’s a necessity for maintaining performance, reliability, and security in today’s complex IT environments. From traditional tools like Nagios to AI-powered platforms like New Relic, the options are vast. The key is to align your monitoring strategy with your infrastructure, goals, and team capabilities. By focusing on the right metrics, setting up smart alerts, and embracing automation and observability, you can transform your system monitor from a simple watchdog into a strategic asset. As technology evolves, so too will the tools and practices of monitoring—making continuous learning and adaptation essential for every IT professional.
Further Reading: